
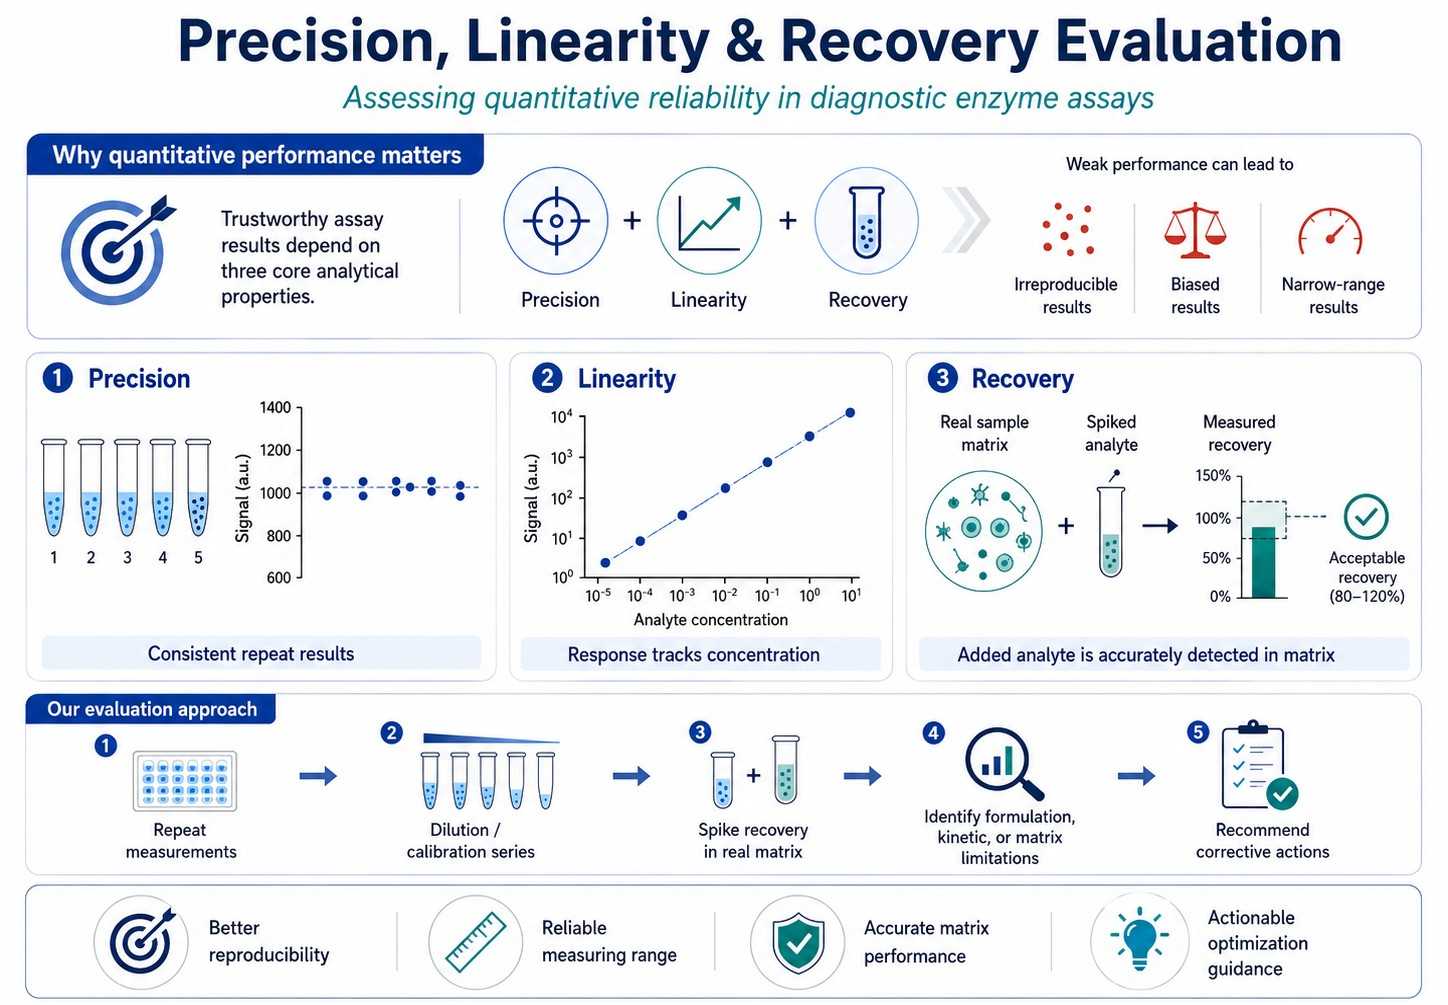
A diagnostic enzyme assay is only useful if its quantitative results can be trusted. Three analytical properties underpin that trust: precision, which describes how consistently the assay repeats a measurement; linearity, which describes whether the response remains proportional to analyte concentration across the measuring range; and recovery, which describes whether the assay detects a known amount of added analyte in a real sample matrix. Weakness in any one of these properties can produce results that are irreproducible, biased, or valid only across a narrow concentration interval.
As part of our Diagnostic Enzyme Assay Development and Troubleshooting Services, Creative Enzymes provides a precision, linearity, and recovery evaluation service for diagnostic enzyme assays. Beyond generating performance data, we interpret deviations in the context of the reaction system itself, identifying the formulation, kinetic, or matrix-related limitations that affect quantitative accuracy and recommending practical corrective actions.
| Item | Summary |
|---|---|
| Starting Point | A new or modified enzyme assay that requires characterization of repeatability, measuring range, proportional response, and analytical recovery. |
| Core Work | Multi-level precision testing, dilution-series linearity assessment, spike-and-recovery studies, and investigation of observed deviations. |
| Primary Output | Precision dataset with CV analysis, linearity and regression results, recovery data, identified limitations, and recommended corrective actions. |
Precision, linearity, and recovery jointly determine whether a result can be interpreted quantitatively. Poor precision undermines confidence in every individual measurement and widens the uncertainty around clinical decision points; non-linearity means that the same bias does not apply across the range, complicating calibration and result calculation; and poor recovery indicates that matrix- or concentration-dependent factors distort the measurement of real samples even when standards behave well. These properties also interact in practice: an assay can appear linear in buffered standards yet fail recovery in patient-type matrices, or show acceptable mid-range precision while becoming unacceptably imprecise near a decision threshold. Characterizing all three properties together therefore provides a coherent picture of quantitative performance and supports assay development, optimization, verification, and troubleshooting with evidence rather than assumption.
Precision is evaluated under conditions that reflect how the assay will actually be used. We assess within-run (repeatability) precision, between-run precision, and between-day precision using samples at multiple concentration levels, including levels near clinical decision points and near the ends of the measuring range. Results are summarized as mean, standard deviation, and coefficient of variation (CV) for each level, with experimental designs informed by established clinical laboratory evaluation protocols.
Equally important is the pattern of imprecision. Concentration-dependent imprecision—for example, an acceptable CV in the mid-range but a sharp deterioration near the detection limit—points toward different root causes than uniform imprecision across all levels. We examine whether imprecision originates in pipetting sensitivity, reaction timing, enzyme or substrate variability, signal instability, or instrument reading noise, so that subsequent optimization addresses the correct variable.
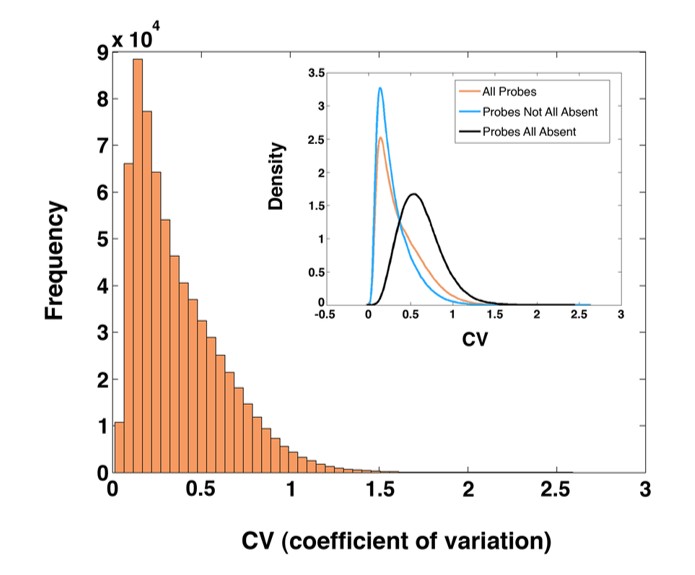 Figure 1. Coefficient of variation (CV) analysis demonstrates high quality of the dataset. (Feng et al., 2009)
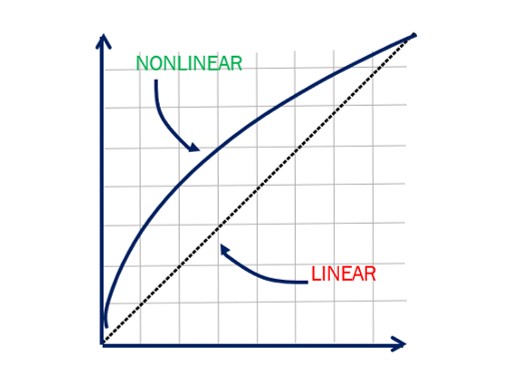 Figure 2. Linearity and non-linearity.
Linearity is assessed across the intended analytical measurement range using dilution series prepared from high- and low-concentration materials. Measured values are compared with expected values by regression analysis, and deviations from proportionality are examined to identify non-linear regions and to establish the practical upper and lower measuring limits of the assay.
For enzyme-based methods, non-linearity frequently has a mechanistic explanation. At high analyte concentrations, substrate depletion, cofactor exhaustion, or enzyme saturation can flatten the response; at low concentrations, blank variability and signal-to-noise limitations can distort proportionality. Product inhibition and detector saturation produce characteristic curve shapes as well. Because we evaluate linearity with the reaction chemistry in mind, the assessment identifies not only where the assay is non-linear, but why—and whether the limitation can be removed through formulation or protocol adjustment.
Recovery studies determine whether the assay measures a known quantity of analyte accurately in the presence of a real sample matrix. We perform spike-and-recovery experiments at multiple analyte concentration levels across representative matrices relevant to the intended specimen type, and calculate recovery as the proportion of added analyte detected. Where dilution of high-concentration samples is part of the intended use, dilution recovery is evaluated to confirm that diluted specimens are measured without systematic bias.
Recovery deviations are analytically informative. Consistently low recovery may indicate matrix binding, incomplete reaction, or an interfering substance that suppresses signal generation; consistently high recovery may reflect endogenous background activity or a matrix component that contributes signal. Recovery that varies with concentration or matrix type points to matrix-dependent bias that must be addressed through formulation, dilution strategy, or calibration design. Because recovery testing exposes the assay to the chemical environment of real specimens, it frequently reveals weaknesses—an insufficiently selective enzyme, a vulnerable detection reaction, an inadequate buffer capacity—that remain invisible when only aqueous standards are measured.
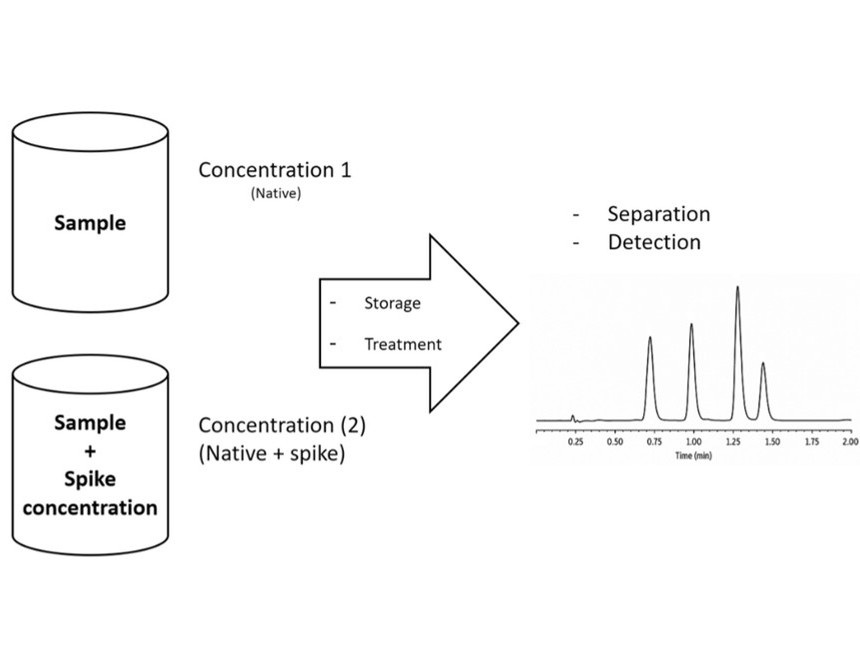 Figure 3. Spike and recovery procedure for speciation analysis validation. (Quiroz, 2021)
When evaluation reveals a deviation, we investigate its origin systematically. Potential causes examined include enzyme concentration variability, substrate limitation, cofactor instability, calibration system mismatch, matrix effects, reaction non-linearity, pipetting or volume sensitivity, instrument reading limitations, and reagent instability. The investigation distinguishes between problems intrinsic to the reaction chemistry and problems introduced by the measurement protocol or the sample matrix.
| Observed Deviation | Frequently Identified Causes |
|---|---|
| Imprecision concentrated at low levels | Blank variability, signal-to-noise limitation, pipetting sensitivity. |
| Non-linearity at high concentrations | Substrate depletion, cofactor exhaustion, enzyme saturation, detector saturation. |
| Low recovery in patient-type matrices | Matrix effects, interfering substances, incomplete reaction. |
| Between-day drift | Reagent instability, calibration shift, environmental sensitivity. |
Based on the findings, we recommend and, where requested, implement optimization measures: adjustment of reaction composition, rebalancing of enzyme-to-substrate ratios, refinement of the calibration strategy, modification of reaction time, sample dilution recommendations, adjustment of the claimed measuring range, or reagent formulation changes. Optimization is verified by re-testing under the same evaluation design, so the improvement is documented rather than assumed.

Typical deliverables include the complete precision dataset with CV analysis, linearity plots and regression results, recovery data, an analytical range assessment, a summary of identified performance limitations, recommended corrective actions, and a comprehensive analytical evaluation report suitable for development records.
This service supports new enzyme reagent development, prototype assay verification, reformulated reagents, raw-material changes, manufacturing process changes, instrument-transfer studies, and troubleshooting of quantitative assay bias. It can be applied as a standalone characterization or as part of a broader development and verification program.
Q1. How many concentration levels and replicates are typically used?
Q2. Can this evaluation support a formal verification study?
Q3. What happens if the assay fails one of the evaluations?
Q4. Can you evaluate recovery in specific sample matrices?
Q5. We changed a raw material and results shifted. Is this service appropriate?
Creative Enzymes evaluates quantitative performance with the reaction chemistry in view, connecting statistical findings to their enzymatic and formulation origins. Our team has hands-on experience with the development and optimization of coupled-enzyme reaction systems, clinical chemistry reagents, and matrix-sensitive metabolite assays, which allows evaluation results to be interpreted by scientists who understand how these assays are built. The result is not only a performance dataset, but a clear, documented path to a more reliable assay.
Characterize and improve the quantitative performance of your diagnostic assay—contact our business development team today!
